Sample Grease Analysis Report
 Grease Analysis Report Description (1)
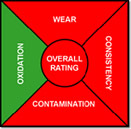
Grease Rating (top right corner of the report)
The Grease Rating provides a green, yellow, red color rating to evaluate each of the four areas examined during the analysis process. Wear, consistency, contamination and oxidation are evaluated individually to give an overall rating to the grease sample. The overall rating receives the worst rating of the four individual tests.
Wear (2) – Wear testing detects the amount of ferrous debris and other wear metals in the grease. Kittiwake’s ANALEX fdM+, RDE Spectroscopy, Direct Read Ferrography and analytical ferrography are used to evaluate wear. FdM+ values are elevated, as well as RDE Ferrous leve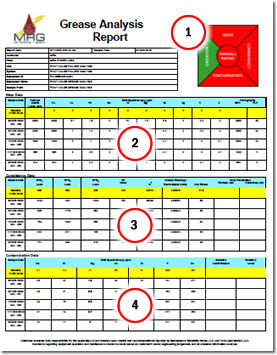 ls. They both have been increasing with each sample; therefore, a red rating is given to wear.
Consistency (3) – Using the Grease Thief the grease is extruded through a specially designed extrusion die to evaluate changes in consistency as compared to the baseline grease. This test shows whether the grease has hardened or softened. This test also simultaneously prepares the sample on a thin plastic substrate for subsequent analysis. Rheometer testing is also used in advanced analysis of consistency. Consistency is given a red rating because it has increased nearly 1.5 times since the original sample. This could be due to excess particulate or mixing of incompatible greases.
Contamination (4) – FTIR and other spectrometric techniques are utilized to determine mixing of different greases. Mixing of grease can be determined by looking at thickener type and additives. Contamination is given a red rating. The FTIR shows mixing of two incompatible thickeners in the sample. Mixing of polyurea and lithium complex grease caused the oil to run out of the grease leaving only the thickeners to do the lubricating.
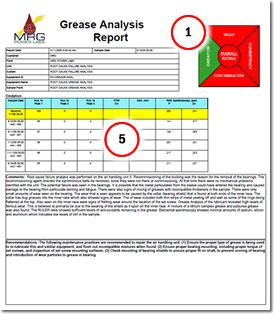 Oxidation (5) – The onset of oxidation can be measured with several tests. Measuring the residual amount of anti-oxidants exiting from the bearing, it can be determined if the re-greasing interval is sufficient for the equipment. FT-IR can also be used to measure the progression of oxidation. Oxidation receives a green rating. In this particular case although the grease is rated severe in all other areas, the grease’s anti-oxidant package is still intact. When the anti-oxidant package remains intact the onset of oxidation is much slower.
Explanation of Tests:
Ferrous Debris Level – The FdM+ value is of most value to the analyst when it is trended over a period of time. In this particular sample the value has increased with each sample along with RDE value in elemental spectroscopy. FdM+ is used as an overall monitoring device for wear concentration. This test uses the Hall Effect to determine the amount of ferromagnetic material present in the sample. This is used a general flagging device for the lab when wear levels are excessively high. Generally when the sample is 5,000 ppm Iron or higher analytical ferrography is recommended.
RDE Spectroscopy – Iron levels in the sample are steadily progressing upward. The spectrometer is useful is detecting certain wear particles, within certain size limitations, such as Iron and babbitt particulate. Certain additive elements are also identified that could point towards grease mixing. Comparing element levels to the original baseline, grease mixing and wear metals are easily detected.
GT Index (GTI) – The consistency of grease is determined by measuring the load under varying speeds during the extraction of the grease through an orifice slot. This is done using a load cell to compress the grease from the Grease Thief onto a thin plastic substrate. The consistency of the grease is compared to the baseline grease to measure changes in consistency to determine thinning or thickening of the grease. The GT Index is determined as the percent consistency of the sample as compared to the baseline. The sample is 1.5 times the consistency of the baseline. This is possibly indicating potential grease mixing that has caused the grease to become thicker.
GT1, GT2 and GT3 – Using the Grease Thief Analyzer, the Grease Thief Loads 1, 2 and 3 measures the consistency of the grease over a series of speed changes (slow → fast → medium). The speed changes create a step change in force which can be compared to the baseline grease that was exposed to the same speed conditions. The variable loads are compared and used to calculate the Grease Thief Index. In this case the loads have greatly increased showing a drastic change in consistency. The numbers are used to find a GT Index of 155.
P and Zn – Zinc and Phosphorus Levels are generally indicative of anti-wear or EP additives. The elemental spectroscopy levels are fairly consistent in the sample indicating not much loss of anti-oxidant. Although, that is not always the case; individual elements can still be present in the sample but not working as a synergistic additive pair. Looking at these elements in combination with the RULER analysis gives a good idea on the amount of anti-oxidant still remaining in the sample.
 RULER (7) – RULER Technology works on the principle of linear sweep voltometry. A variable voltage is applied to the sample while the current flow is measured. The presence of anti-oxidant remaining in the sample is determined. The sample shows a fairly consistent response from the RULER indicating a strong presence of anti-oxidant remaining in the sample.
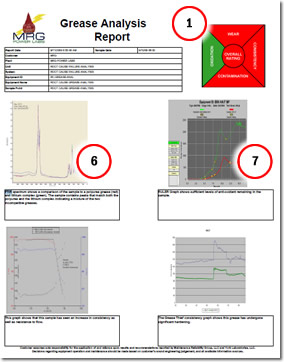
GT Consistency Graph – The Grease ThiefConsistency Graph shows the step changes occurring between the 3 variable speeds to which the grease was exposed. The green line is the baseline graph and the thinner blue line is the sample. Significant hardening has taken place when the sample is compared to the baseline.
FTIR Spectrum (6) – The FTIR Spectrum is used to fingerprint the grease and compare to the baseline grease. Oxidation, additive depletion, and grease mixing can be determined with FTIR. In this particular sample there is mixing between two incompatible thickener types. The sample actually splits the two grease baselines indicating a strong presence of both polyurea and lithium complex grease in the sample.
RULER Graph (7) – The RULER Graph is used to show how much anti-oxidant is remaining in the sample. The green line is the baseline grease and the red line is the sample. The RULER Graph shows a significant amount of anti-oxidant remaining in the sample.
Rheometer Graph – Rheometer Testing is further consistency testing that is able to be done on a small amount of sample.
Photographs – Photographs are provided with explanations of where the root cause of the problem stemmed.